Case in Neuroimaging
The role of the central brain clock in the pathophysiology of insulin resistance
Biological clocks in our body regulate our daily sleep-wake rhythms. Our central biological clock, the “master brain clock”, is located in the brain, in the hypothalamic suprachiasmatic nucleus (Fig.1). For the suprachiasmatic nucleus, the most important time cue is light input (especially blue light with a wavelength of ± 480 nm) received via the eye.
Animal studies and post-mortem human brain studies suggest that the suprachiasmatic nucleus plays a role in the development of insulin resistance (1), but it is unknown if in vivo rhythms of the suprachiasmatic nucleus are disturbed in people with insulin resistance.
Using ultra-high field 7T functional MRI, Esther Speksnijder and her colleagues at the Amsterdam UMC are performing an observational study to determine the daily rhythm of light responsiveness of the suprachiasmatic nucleus in people with progressive stages of insulin resistance (Fig. 2). The high spatial and temporal resolution at 7 Tesla allows them to capture the hemodynamic response at a small scale (e.g. the area around the suprachiasmatic nucleus). Additionally, at the Spinoza Center for Neuroimaging, they have the opportunity to scan the same participants at different times during the day and night.
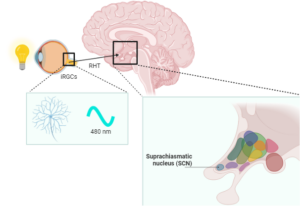
Figure 1. The location of master brain clock in the suprachiasmatic nucleus. Light input is transmitted from the intrinsic photosensitive retinal ganglion cells (iRGCs), via the retinohypothalamic tract (RHT), directly to the suprachiasmatic nucleus. Created with BioRender.com.
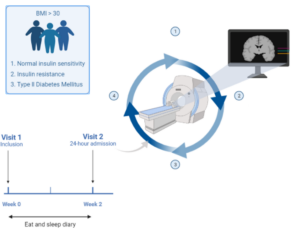
Figure 2. Study setup: Participants with a BMI>30 and type 2 diabetes, insulin resistance, or normal insulin sensitivity were included. Participants filled in a food and sleep diary for two weeks and wore a movement watch (Actigraph). After two weeks, participants were scanned for four times in 24 hours. Created by Marloes D.A. Bet with BioRender.com.
This research is funded by an Amsterdam Gastroenterology Endocrinology Metabolism (AGEM) talent development grant to D.J. Stenvers.
References
- Speksnijder EM, Bisschop PH, Siegelaar SE, Stenvers DJ, Kalsbeek A. Circadian desynchrony and glucose metabolism. J Pineal Res. 2024;76(4):e12956.